Application Whitelisting on Windows and App Execution Analytics (using AppLocker, AppIDSvc and Splunk)

If you familiar with security compliance requirements such as PCI DSS or HIPAA – one of the requirements is “application whitelisting”. Application whitelisting is the solution that allows execution of pre-approved apps and scripts only and disallow rest.

Application whitelisting can be done using many tools – in this example I will discuss how to get application whitelisting done using in-build Windows tools; I will use Windows AppLocker utility to implement application whitelisting. I will discuss setting up Splunk for AppLocker, so that we get real time visibility/analytics of application whitelisting and alerting.

This HOWTO got two parts –

Part 1 – this discuss technical steps regarding how to setup application whitelisting on Windows platform and push the settings to bunch of windows computers.

Part 2 – this discuss technical steps regarding how to get visibility, analytics and alerts about the application whitelisting using Splunk (e.g. application whitelisting logs showing which apps are allowed, which are denied, who executed the app, when, from where etc).

Part 1 – Setting up the Application Whitelisting on Windows

Following are the steps for Part 1.

Step1: Start the “Application Identity” (AppIDSvc) service & set to start automatic

AppIDSvc service is a Microsoft service used by AppLocker to determine and verify the identity of an application. Without AppIDSvc AppLocker is unable to determine and verify application, scripts, installers and executables.

AppWhitelist1-AppIDSvc

Step2: Setup Application Whitelisting using “Local Group Policy Editor” or “Group Policy Management Console”

AppLocker settings are available within “Computer Configuration -> Windows Settings -> Security Settings -> Application Control Policies -> AppLocker”. In an ideal environment all the AppLocker settings should combines into a single Group Policy Object (GPO) and pushed onto computers via Active Directory.

Set the policy “Enforcement rules” first

Right click on the AppLocker -> go to Properties -> Select “Enforcement rules” for both Executables and Scripts. Enforcement rule enforces “allow” and “deny” operations.

“Executable rules” are applied to application programs installed on the Windows OS.
“Scripts rules” are applied to all scripts available on the Windows OS.

“Audit only” – this setting does not prevent execution rather it generates audit logs only about what items are executed on the Windows OS and who executed it.

AppWhitelist2-AppLockerProperty

Set the Executable Rules

Set allow or deny action to executable application here; few options available here –

Executable Rules based on “Publisher” – allow all signed software by authorised publisher.
Executable Rules based on “Path” – allow specific file or folder. I prefer this.
Executable Rules based on “File hash” – this is for application which are not sighed.

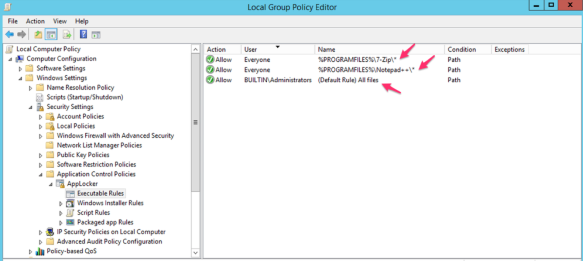
Example screenshot of “Executable Rules” – in this example users (everyone) are allowed ONLY to execute “7-Zip” and “Notepad++” which are installed within “C:\Program Files\” or “C:\Program Files (86)\”; whereas “Administrators” can execute all; there is a “Deny” by default for rest.

Interestingly the same variable “%PROGRAMFILES%” returns both “C:\Program Files\” & “C:\Program Files (x86)”.

AppWhitelist3-LocalGPO

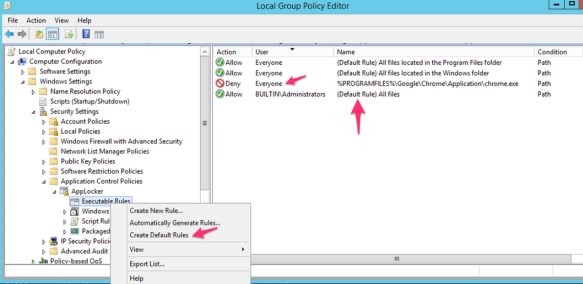
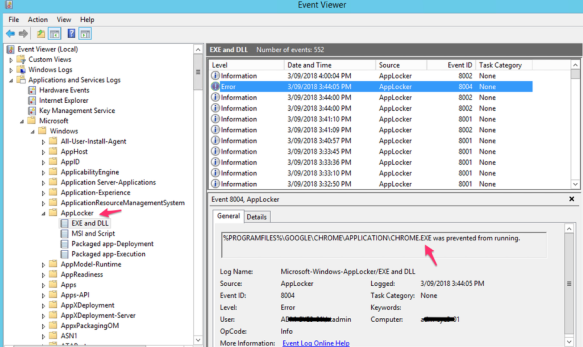
Following screenshot example shows default “Executable rules” which permits everything along with a rule to deny “Google Chrome” for everyone including Administrators; deny overrides other options.

AppWhitelist4-LocalGPO2

Set the Script Rules

Script rules options are same as the executable rules – Publisher, Path and File Hash along with Allow or Deny. Also, you can create default rules which allows everything.

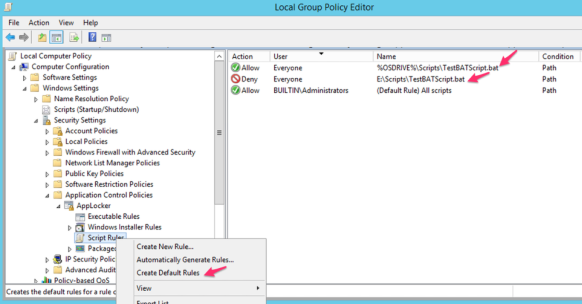
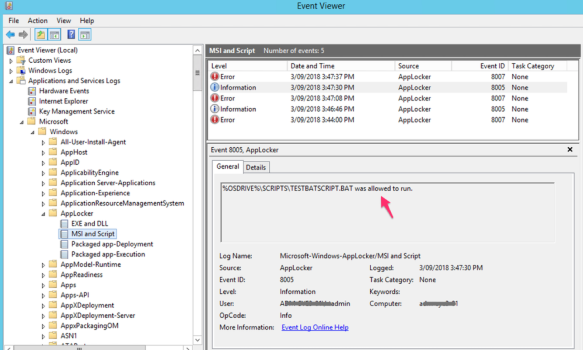
Following “Script Rules” screenshot shows the same BAT file “TestBATScript.bat” is allowed on the %OSDRIVE% which is the “C:\Scripts” for users and denied on the “E:\Scripts\” for everyone.

AppWhitelist5-LocalGPO3

If the above settings are pushed via GPO – it requires some time to applied to the destinations computers. This can be forced or the destination computer can be rebooted to get these settings immediately pushed.

Also, if we remove AppLocker settings on a computer – this takes few minutes (2-5min) to take effect as well; don’t expect result immediately.

Step3: Verification

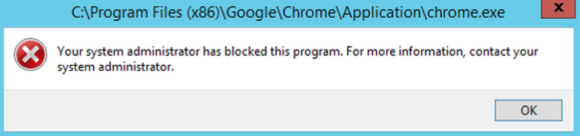
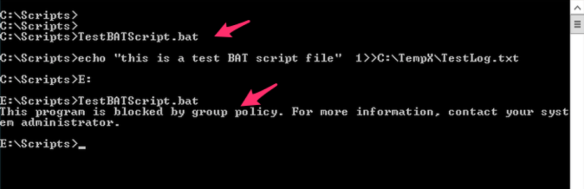
As we have configured “Deny” on the “Google Chrome” for all users – it will pop-up with the following error message when someone tries to open it up –

AppWhitelist6-ErrorChrome

Also, we have configured the “TestBATScript.bat” to allow execute from “C:\Scripts” and deny from “E:\Scripts\”; following screenshot says it all –

AppWhitelist7-ErrorScripts

Part 2 – Visibility and Analytics of Application Whitelisting using Splunk

A complete real time visibility and analytics of application executables and scripts across all the servers (100+ servers) are important to support the platform. Following are interesting items to application whitelisting analytics –

  • Who is executing what application
  • On what servers/system
  • What application are allowed
  • What application are denied
  • When/What time an application executed
  • Knowing the system applications
  • Knowing user defined applications
  • Sending alert email when an application/script execution is blocked

The above key interesting items about application whitelisting are available within AppLocker Windows Event Log files; the location of these logs are at Event Viewer -> Application and Services Logs -> Microsoft -> Windows -> AppLocker (EXE and DLL; MSI and Script). Example screenshots are following –

AppWhitelist8-EventLogs

AppWhitelist9-EventLogs2

To get real time analytics of what’s happening within AppLocker onto Splunk – we need to redirect AppLocker logs onto -> Splunk using the “Splunk Universal Forward”.

Setup Splunk Universal Forwarder (SUF)

SUF is free downloadable from www.splunk.com; download and install it on the target Windows computer. Ideally, it should be part of base Windows OS build template – so that we don’t need to install it manually every time.

During the SUF installation – we select the following “Security Log” only; although this is not a requirement for AppLocker to select security log; however, selecting security logs fulfil many compliance requirements. Select other type logs based on business requirements; also event logs selection can be done later on after the installation.

Make sure your Splunk server is up and running.

[select Windows Event Logs]

AppWhitelist10-SUF1

Enter the Splunk server IP address and receiving port number to redirect logs to.

[Enter the destination Splunk receiving server and port number]

AppWhitelist11-SUF2.png

After the installation – add the following lines onto the SUF local site config file “C:\Program Files\SplunkUniversalForwarder\etc\system\local\input.conf” –

[WinEventLog://Microsoft-Windows-AppLocker/EXE and DLL]
disabled = 0
evt_resolve_ad_obj=1

[WinEventLog://Microsoft-Windows-AppLocker/MSI and Script]
disabled = 0
evt_resolve_ad_obj=1

The above lines will redirect AppLocker “EXE and DLL” and “MSI and Script” logs onto -> Splunk; the “evt_resolve_ad_obj=1” will allow identify/show Active Directory user names.

Restart the SUF service.

At this stage AppLocker logs will start flowing onto the Splunk; based on index settings Splunk will automatically add these log entries onto the respective index or to the default index.

Following are few examples of AppLocker analytics dashboards within Splunk –

Screenshot of who/what action/what application/when/from is following; Splunk search string for this:

source="WinEventLog:Microsoft-Windows-AppLocker/*"| table host, User, Type, Message, _time

AppWhitelist12-Splunk11

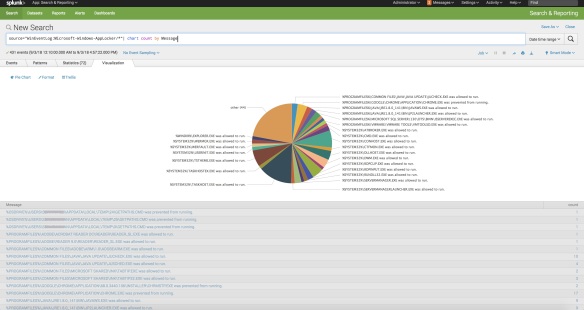
Screenshot of total number of applications following; Splunk search string for this –

source="WinEventLog:Microsoft-Windows-AppLocker/*"| chart count by Message

AppWhitelist13-Splunk22

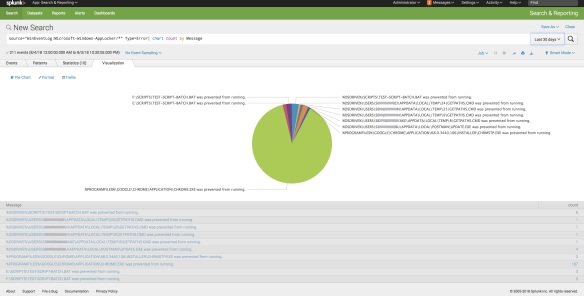
Screenshot of total number of denied applications is following; Splunk search string for this –

source="WinEventLog:Microsoft-Windows-AppLocker/*" Type=Error| chart count by Message

AppWhitelist14-Splunk33

Screenshot of email alert when there is a deny following; Splunk search string is following –

source="WinEventLog:Microsoft-Windows-AppLocker/*" Type=Error | table host, User, Message, _time

AppWhitelist15-Splunk44

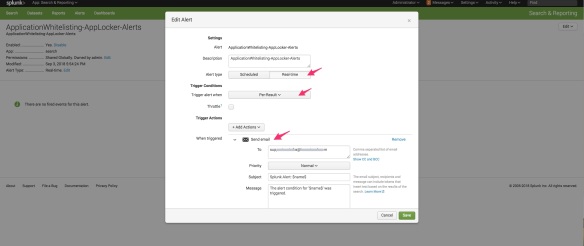
[Screenshot of Splunk alert email triggered on deny condition]

AppWhitelist16-Splunk5Main

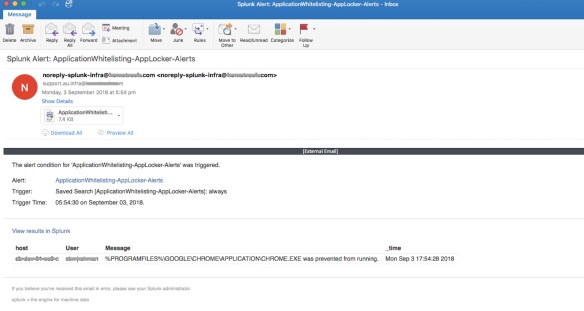
One of the key reason for alert emails – incase any “required” apps missed out from whitelisting – you will get details of the app even before the end user/team tells you to whitelist it.

Thats ALL!


Cisco Nexus vPC and non-vPC VLANs together on the same platform (Nexus hybrid setup) – NXOS v7.0(3)4(1)

Cisco discontinued “spanning-tree pseudo-information” starting from NXOS version 7.0(3)4(1) on the 9000 platforms. So what is the solution for Nexus vPC and non-vPC VLANS on the same platform (hybrid)? Is it no longer going to be supported on NXOS/9000 platforms?

Although hybrid is not recommended vPC design for “aggregation layer” but you find a lot scenarios where you need to have both vPC and non-vPC within the same platform (mostly in mid-size data centres; where you have a lot reasons you can’t deploy traditional ethernet switches; hence you have considered the Cisco Nexus platforms).

If you carry everything (both vPC VLANs and non-vPC VLANs) over the vPC peer-links (yes, vPC carry orphaned VLANs as well!) – in this case if there is any issue happen on the vPC peer links and that stops the vPC working, the downstream switches those are connected to the Nexus via non-vPC/non-vPC VLANs will stop forwarding frames due to STP (any STP – STP/RSTP/PVSTP/MSTP) blockage as they don’t have any information about what happened between the vPC peer Nexus switches in a vPC peer failed scenario.

Experts suggest that you should have an additional Layer 2 trunk port-channel alongside your vPC peer-link; this Layer 2 port-channel will carry non-vPC VLANs in case vPC stops working (whatever reason; could be a Nexus reboot during maintenance!).

Well, now you have setup a seperate Layer 2 trunk port channel for non-vPC VLANs and shutdown the vPC peer link to test it – but you found it is still not working as expected! STP is blocking the Layer 2 trunk link, whats the problem! Cisco used to have a solution for this called “spanning-tree pseudo-information“; as I have mentioned in the beginning Cisco discontinued this starting from version 7.0(3)l4(1) on the Nexus 9000 platform. So what is your option for this? Should you stop using Nexus if you don’t follow spine and leaf design?

Yes – there is an answer to this, there is a small trick to make this working! By discontinuing psuedo-information, Cisco basically makes it ever easier to configure; you need to do the following –

i. First, you need to set STP root priority for the VLANs to a lower priority number on one of Nexus switch (default priority is 32768, lower is prefer; this should be done on the primary vPC role Nexus switch) and leave STP untouched on the other Nexus switch (this is the vPC secondary role switch).

ii. Second, on the non-vPC trunk port-channel set “spanning-tree port type normal” on “both” the switches; (“spanning-tree port type network” is recommended for vPC peer-link).

Here is an example config -Here is an example config –

On the vPC primary role switch, apply the following -

(config)#spanning-tree vlan 10,20,30,40-50 priority 8192

On both the switches, apply the following -

(config)#interface port-channel10
(config-if)#description "non-vPC trunk port" 
(config-if)#switchport 
(config-if)#switchport mode trunk 
(config-if)#switchport trunk allowed vlan 10,20,30,40-50 
(config-if)#spanning-tree port type normal

Without having the above configuration applied you will find STP is blocking the non-vPC Layer 2 trunk link even if the vPC peer-link is shutdown. Also in this example – the vPC primary role switch will be the STP “root bridge” because of lower priority configured (8192).

To test your configuration – shutdown the vPC peer-link, run “show spanning-tree vlan xxx” – you should see STP put the L2 trunk interfaces in forwarding state immediately.

Here is a vPC and non-vPC VLANs on the same platform diagram –

CiscoNexus-Hybrid


Cisco UCS Platform Emulator – UCSPE 3.1(2ePE1)

Cisco UCS Platforms are expensive kit to play with. UCS Platforms are not just a standalone router, switch or a firewall that could easily be emulated on a PC – they are bunch of kits interconnected together to deliver the UCS platform. UCS is not a server – it’s a system or a platform compared to traditional computing; UCS comes with unified (LAN/SAN/FC/FCoE/HBA/others) and stateless computing together.

Cisco has come up with a solution to help engineers to get their hands dirty on UCS Platforms – the solution is called Cisco UCS Platform Emulator (UCSPE). The latest UCSPE is version 3.1(2ePE1). Cisco made UCSPE available to everyone – you only need to have a Cisco login.

The whole UCSPE comes with the following-

i. 2 x Fabric Interconnect (Model: UCS-FI-6332-16UP)
ii. 2 x FEX (Model: Nexus 2348UPQ N2K-C2348UPQ)
iii. 3 x UCS 5108 Chassis with 12 x different model blades
iv. 1 x UCSC C3X60 server (Model: UCSC-C3X60)
v. 7 x UCS C series servers (220/240/460)

The above are enough to emulate a complete decent size UCS Platform!

Yes! you can create bunch of full fledged “Service Profiles” with different configurations settings and applied them to the servers; also you can configure the fabric interconnect ports with different options (LAN uplink/Server uplink/FC/FCoE/NAS/Port Channels etc)

UCSPE comes in “OVA” and “VMware VMX/VMDK” format (in a ZIP file); you can run it on VMware Workstation or Fusion (I use Fusion).

The pre-defined OVA/VMX requires only one (01) vCPU, 1024MB memory and 3 x vNICs.

You need 3 x IP address (could be from DHCP or static) to make it accessible – one IP address is for Fabric Interconnect “A”, second one is for Fabric Interconnect B and the third IP address is the VIP of FI-A and FI-B Cluster.

Thats all! Its a great tool for candidates learning towards CCNA/CCNP/CCIE Data Centre certifications as well.

UCSPE download link is the following:
https://communities.cisco.com/docs/DOC-71877

Following are few screenshots:

UCSPE-VM-1

[UCSPE VM console]

UCSPE-Platform-01

[UCSPE devices list. They covered a lot devices in here! The red arrow is showing the icon of UCSM – you need to click on this to launch UCSM]

UCSPE-Platform-02

[UCSM – Login Screen]

UCSPE-Platform-Topology-01

[UCSM- The Topology]

UCSPE-Platform-Fabric-A-01

[UCSM- FI “A”]

UCSPE-Platform-01-5108-Chassis

[UCSM – UCS 5108 Chassis]


Cisco UCS 5108 Chassis Power Policy Options and Redundancy Demystify

Cisco UCS server chassis 5108 comes with three (03) different Power Policy options; UCS power management is efficient and energy saving by default but NONE of the policy option explanation says which PSUs will be full ON and which PSUs will be put on to Power Saving Mode. This is what official Cisco document says about these options:

  • Non Redundant – All installed power supplies are turned on and the load is evenly balanced. Only smaller configurations (requiring less than 2500W) can be powered by a single power supply.
  • N+1 – The total number of power supplies to satisfy non-redundancy, plus one additional power supply for redundancy, are turned on and equally share the power load for the chassis. If any additional power supplies are installed, Cisco UCS Manager sets them to a “turned-off” state.
  • Grid – Two power sources are turned on, or the chassis requires greater than N+1 redundancy. If one source fails (which causes a loss of power to one or two power supplies), the surviving power supplies on the other power circuit continue to provide power to the chassis.

Probably the above definition applied to old version UCS and not the latest. Also I couldn’t find details on what exactly happen on power redundancy when you have 2 x PSUs and 4 x PSUs installed and your power load is not very high due to not all the blades are installed and functional.

Cisco-UCS-PowerPolicy-1

Following are what I captured regarding which PSUs will be ON and PSUs will be put on to Power-Saving-Mode when you set different “Power Policy” options – this is done a four (04) PSU server chassis. Changing in Power Policy takes effect immediately (might be a 10-20 second delay to refresh the Web GUI) and it doesn’t require any system reboot.

Assumption is all the four (04) PSUs are installed and connected to power socket; also the chassis is running 2 blades.

When Power Policy is set N+1, this is what happen:

PSU1 – ON
PSU2 – ON
PSU3 – OFF (Power Saving Mode)
PSU4 – OFF (Power Saving Mode)

When Power Policy is set GRID, this is what happen:

PSU1 – ON
PSU2 – OFF (Power Saving Mode)
PSU3 – ON
PSU4 – OFF (Power Saving Mode)

When Power Policy is set Non-Redundant, this is what happen (only one is ON! not ALL):

PSU1 – ON
PSU2 – OFF (Power Saving Mode)
PSU3 – OFF (Power Saving Mode)
PSU4 – OFF (Power Saving Mode)

Data centre racks are equipped with two power rails – A (left hand side) & B (right hand side) for redundancy. Now interesting thing is – your physical power connection must be in-line with the UCS Power Policy options, otherwise your blades will be rebooted in case any power issue on “power rail A”.

You can have only two different combinations of power connections to connect all the four (04) PSUs to the power rails A & B. The combinations are following –

Option 1:
PSU1/PSU2 (first two) connected to > power rail A
PSU3/PSU4 (last two) connected to > power rail B

Option 2:
PSU1/PSU3 (odd numbers) connected to > power rail A
PSU2/PSU4 (even numbers) connected to > power rail B

I had N+1 configured with “Option 1” and power issue due to maintenance on rail A rebooted my blades!

This is what happen as following – either “you are saved” during a power failure on rail A! or “you are not saved!

GRID Mode with (Option 1) PSU1/PSU2 to A & PSU3/PSU4 to B;You are saved!
PSU1 – A ON
PSU2 – A OFF (Power Saving Mode)
PSU3 – B ON
PSU4 – B OFF (Power Saving Mode)

GRID Mode with (Option 2) PSU1/PSU3 to A & PSU2/PSU4 to B;You are NOT saved
PSU1 – A ON
PSU2 – B OFF (Power Saving Mode)
PSU3 – A ON
PSU4 – B OFF (Power Saving Mode)

Screenshot of GRID mode following –

Cisco-UCS-PSU-GRID-Pic1

N+1 Mode (Option 1) PSU1/PSU2 to A & PSU3/PSU4 to B;You are NOT saved!
PSU1 – A ON
PSU2 – A ON
PSU3 – B OFF (Power Saving Mode)
PSU4 – B OFF (Power Saving Mode)

N+1 Mode (Option 2) PSU1/PSU3 to A and PSU2/PSU4 to B;You are saved!
PSU1 – A ON
PSU2 – B ON
PSU3 – A OFF (Power Saving Mode)
PSU4 – B OFF (Power Saving Mode)

Screenshot of N+1 mode following –

Cisco-UCS-PSU-N1-Pic1

Non-Redundant Mode (Option 1) PSU1/PSU2 to A & PSU3/PSU4 to B;NOT saved!
PSU1 – A ON
PSU2 – A OFF (Power Saving Mode)
PSU3 – B OFF (Power Saving Mode)
PSU4 – B OFF (Power Saving Mode)

Non-Redundant Mode (Option 2) PSU1/PSU3 to A & PSU2/PSU4 to B;NOT saved!
PSU1 – A ON
PSU2 – B OFF (Power Saving Mode)
PSU3 – A OFF (Power Saving Mode)
PSU4 – B OFF (Power Saving Mode)

Screenshot of Non Redundant mode following –

Cisco-UCS-PSU-NonRedundant-1.jpg

F5 iRule with Data Group

I often implement large list of IP and URL whitelisting/HTTP header based controls on F5 using iRules and Data Groups. What I found is “Data Groups” are one of the easiest way to handle a large number of matching keys and values!  As per F5 official documents – data group is the simplest way to maintain a list of permanently matched keys and values. A large list IP address or URL or any string/integer matching can be easily fit within iRule using data groups. Add/Remove entries within data groups are super easy.

Some old documents mentioned that data groups have impact on performance – truth is since TMOS v10.x and above data groups have minimum performance impact. F5 did some testing on performance using data groups and here’s some of the results (copied from F5 site):

The testing was done using 10,000 CPS, 1 HTTP request per TCP connection.

Baseline: TCP + HTTP profile + Blank iRule (when RULE_INIT { } )

Baseline results: Total CPU % used = 23%; TMM CPU % used = 16%; TMM Mem (MB) = 254

Check using iRule that I used in the video against datagroup with 1,000 entries (and no match found, so the entire group is forced to be searched).

Results: Total CPU % used = 25%; TMM CPU % used = 18%; TMM Mem (MB) = 259

Check against datagroup with 2,000 entries (no match found).

Results: Total CPU % used = 25%; TMM CPU % used = 18%; TMM Mem (MB) = 261

Check against datagroup with 10,000 entries (no match found).

Results: Total CPU % used = 26%; TMM CPU % used = 18%; TMM Mem (MB) = 277

So, even with a datagroup with 10,000 entries, the performance hit is minimal.

Here is an example of how to use data groups within iRules; lets say – to whitelist a list of IP address and block requests at TCP layer (TCP three-way handshake which happens before HTTP) – (i)we will create two test data groups and (ii)then bundle them together in an iRule and (iii)finally apply to a virtual server.

i. create data group A – iRules > Data Group List – create “test_data_group_A”; set type Address; enter all the IP address or you can import list file or add them to “/config/bigip.conf” (reload configuration if you edit the /config/bigip.conf manually). This is what it looks like –

ltm data-group internal /Common/test_data_group_A {
 records {
 1.1.1.1/32 { }
 1.1.1.2/32 { }
 1.1.1.3/32 { }
 2.2.2.1/32 { }
 2.2.2.22/32 { }
 }
 type ip
}

ii. follow the same above and create “test_data_group_B”
iii. create an iRule and put them together to allow requests only from the listed IPs (use “class match” command to refer to a data group) –

when CLIENT_ACCEPTED {
if {[class match [IP::client_addr] equals test_data_group_IP_A] } 
{}
elseif {[class match [IP::client_addr] equals test_data_group_IP_B] }
{} 
else
{drop }
}

iv. Apply the above iRule to a virtual server

Thats all! the above should only allow the IPs listed on the Data Groups.

In case if it is required to add/remove new IPs – then only add them to the data groups; no need to touch the iRule anymore.


10 handy F5 LTM iRules I often use

These are the few handy (10) F5 LTM iRules I use very often. I am keeping a copy here as my reference and this might help others as well.


1. Log all http access headers (client access request & response) – this will send logs to /var/log/ltm.

++++
when HTTP_REQUEST {
   set LogString “Client [IP::client_addr]:[TCP::client_port] -> [HTTP::host][HTTP::uri]”
   log local0. “=============================================”
   log local0. “$LogString (request)”
   foreach aHeader [HTTP::header names] {
      log local0. “$aHeader: [HTTP::header value $aHeader]”
   }
   log local0. “=============================================”
}
when HTTP_RESPONSE {
   log local0. “=============================================”
   log local0. “$LogString (response) – status: [HTTP::status]”
   foreach aHeader [HTTP::header names] {
      log local0. “$aHeader: [HTTP::header value $aHeader]”
   }
   log local0. “=============================================”  
}

+++++


2. Log client_ip only (the above example show IP as well) – this will send client_ip address to /var/log/ltm.

+++
when CLIENT_ACCEPTED {
  log “CONNECT: [IP::client_addr]”
}
+++++


3. Redirect HTTP to > HTTPS

++++
when HTTP_REQUEST {
if { [string tolower [HTTP::host]] ends_with “.myfqdn.com.au” } {
HTTP::redirect https://www.myfqdn.com.au [HTTP::uri] #no space
}
else {
reject
}
}
+++++


4. Allow our DNS host names only – we don’t allow domain names which doesn’t belongs to us. We only accept “mydomain.com.au” and subdomains within it for our virtual servers.

++++
when HTTP_REQUEST {
            if { [string tolower [HTTP::host]] equals “mydomain.com.au” || [string tolower [HTTP::host]] ends_with “.mydomain.com.au” } {
            }
            else {  
                        reject
            }
}
+++++


5. If all pool members are down – redirect HTTP Requests to our maintenance web site –

+++++
when HTTP_REQUEST {
if { [active_members [LB::server pool]] == 0 } {
HTTP::redirect “https://maintenance.mydomain.com.au/#no space
}
}
++++++


6. If ALL pool member is down, display “site is under maintenance from the F5” from the F5.

++++++
when HTTP_REQUEST {
if { [active_members [LB::server pool]] == 0 } {
HTTP::respond 200 content “<p><h3>This site is currently under maintenance – please try again later.</h3></p>”
}
}
+++++


7. If all pool members are down – return 200 OK with content from the F5 –

++++
when HTTP_REQUEST { 
    if { [active_members [LB::server pool]] == 0 } {
        HTTP::respond 200 content “<p><h3>This site is currently under maintenance – please try again later.</h3></p>”
    }
 }
+++++


8. URI rewrite – if client try to access “/application” rewrite/send them to “/application/ver1.1”

++++
when HTTP_REQUEST {
    switch [HTTP::uri] {
        “/application” {
          HTTP::uri “/application/ver1.1”
        }
           }
}
+++++++++


9. Rewrite URI based on HTTP Header – URI rewrite is transparent to client whereas HTTP::redirect to new address is not which return HTTP code 3xx to client.

+++++
when HTTP_REQUEST {
    switch [HTTP::header X-APP-Version] {
        “app1.0” {
            HTTP::uri “/app/default1.0”
        }
        “app2.0” {
            HTTP::uri “/app/default2.0”
        }
    }
}
++++++


10. HTTP redirect based on http header – HTTP redirect 307 preserve what present within a initial POST request whereas other 30x such as 301/302 does not preserve any data in initial POST.

+++++++
when HTTP_REQUEST {
            if { [HTTP::header X-APP-NAME] contains “myapp1”}
            {
                                    HTTP::respond 307 “Location” “https://myapp.abc.com/api/myapp1.0#no space
            }
            else {
                                    HTTP::respond 307 “Location” “https://myapp.abc.com/api/myapp2.0#no space
            }
}
+++++++++