Cisco IOS event details can be send to an external system via “syslog”. Splunk server itself and Splunk Universal Forwarder both can act as a syslog server to accept logs from Cisco IOS devices.
To add more cream to Splunk log consolidation solution for Cisco IOS devices – there are few Splunk plugins already available on Splunk App store! These plugins display IOS events on nice colorful dashboards with graphs & charts.
Let’s talk about how we can get this solution in place.
Technical dependencies to get this solution are following –
1. Cisco IOS devices (routers, switches, wlc, asa) configured to send IOS event to Splunk via “syslog”
2. Splunk Indexer (actually this is the Splunk server)
3. (optional) to get nice dashboards it needs two Splunk Apps – (i)Cisco Networks Add-on (TA-cisco_ios) (ii)Cisco Networks (cisco_ios)
Regarding the solution design, there are two options as following –
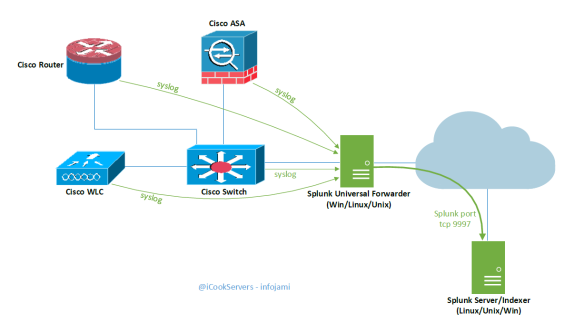
1. Send logs to Splunk via Splunk Universal Forwarder; this design suits very well in a large infrastructure. Splunk Universal Forwarder can act as local “syslog” for IOS devices; picture below-
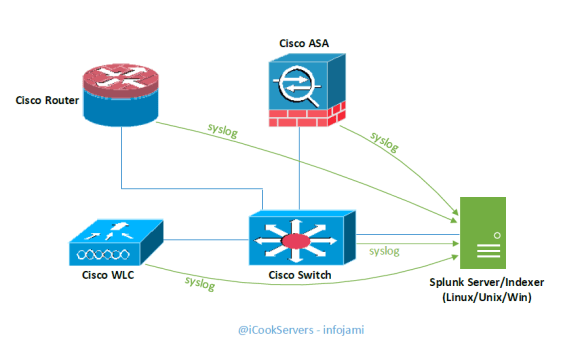
2. Send logs directly to the Splunk server –
Installation technical procedures are following –
Step 1: Configure Cisco IOS to Send Logs to Splunk “syslog”
Following is an example configuration on a Cisco router –
router# config t
router(config)# logging trap notifications
router(config)# logging 1.1.1.1 ;IPAddr of Splunk syslog – if syslog is running other than UDP 514 – this needs to be specify here
The following commands will send Cisco IOS command execution history to syslog –
router(config)# archive
router(config-archive)# log config
router(config-archive-log-cfg)# logging enable
router(config-archive-log-cfg)# logging size 1000
router(config-archive-log-cfg)# hidekeys ;this will not send passwords to syslog
router(config-archive-log-cfg)# notify syslog
router(config-archive-log-cfg)#exit
Step 2: Configure Splunk or Splunk Universal Forwarder to Accept Logs on UDP://514
There are multiple ways to ways to do this. Adding new listener & sourcetype to “inputs.conf” works for both universal forwarder and Splunk server running on any platform.
On Linux/Unix the default location of this file is – $SPLUNK_INSTALLATION_DIR/etc/system/local/
On Windows the default location of this file is – x:\Program Files\SplunkUniversalForwarder\etc\system\local\
Add the following to the “inputs.conf” file –
[udp://514]
sourcetype = cisco:ios
Restart “splunk” service or “SplunkUniversalForwarder” service to get this change take effect.
If you add “sourcetype = syslog” – this will also work. The “Cisco Network Add-on (TA_cisco-ios)” transforms Cisco syslog to “cisco:ios” sourcetype automatically.
At this stage you should start getting logs coming on to Splunk. Execute some random commands on Cisco IOS and search for sourcetype=”cisco:ios” on Splunk search tab – you should be able to see logs like similar to following –
Step 3 (optional): Install Splunk Cisco Apps to Display IOS Events on Dashboards
Install the following two Apps from “Apps > Find More Apps > search Cisco” –
- Cisco Network Add-on (TA-cisco_ios)
- Cisco Networks (cisco_ios)
Installation is very straight forward – just click on the icon to install it.
If you still not seeing any logs on the Dashboard of Cisco Networks – this might be incorrect “sourcetype” issue and “TA-cisco_ios” is not doing the source type transformation – in this case change your source type to “cisco:ios” manually or you can log a support case with Splunk support to get the TA-cisco_ios fixed for you.
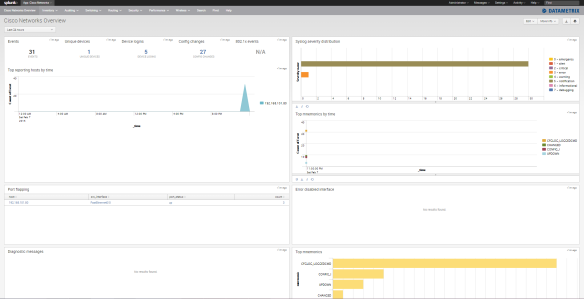
You should be able to see the following on Dashboards –
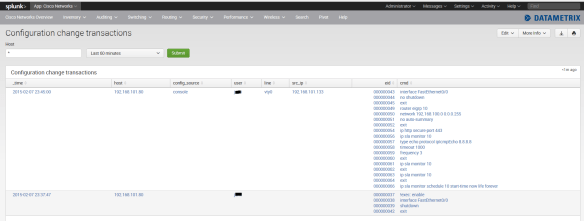
(command execution history – who has done what?)

There are lot more you can find here on this dashboard – explore it.


